D3.js data dashboard: The State of 10 Cities
Published | Project
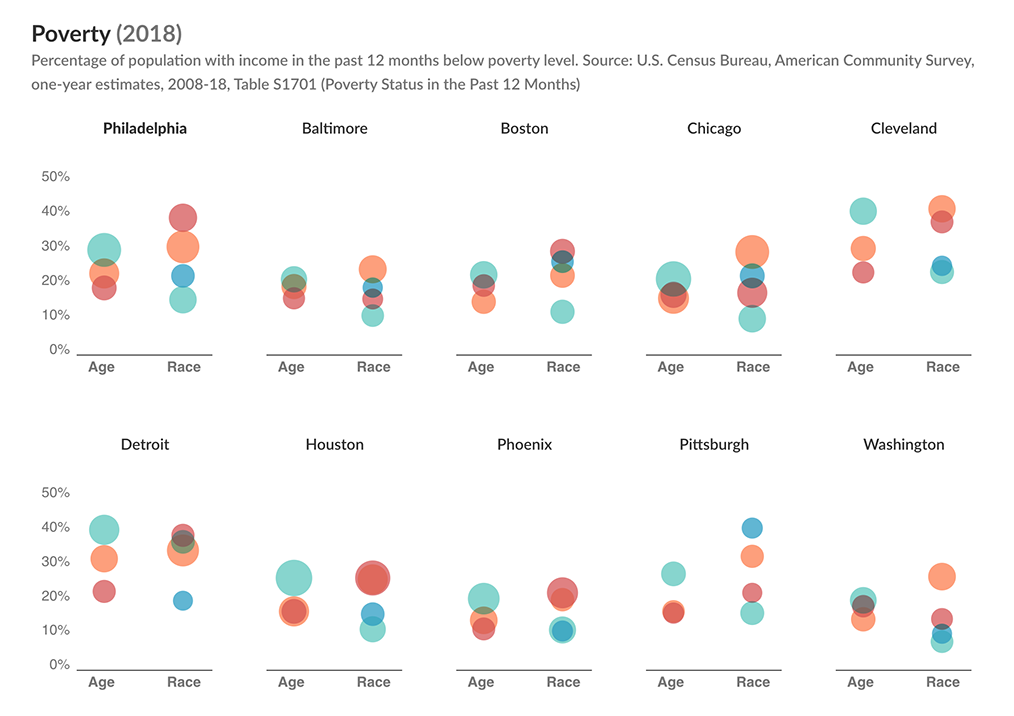
"The State of 10 Cities . . . allows you to analyze data from 10 U.S. cities on key economic, social, and demographic indicators over the past decade.
- Compare cities over time or with each other.
- Separate data for certain indicators by age and race.
- Gain insights into how cities have changed on 14 key measures over the past decade."
Graphs are built on D3.js Offers over-time view of aggregated data for each indicator and a view showing the latest year’s data disaggregated by age and race.

